Matplotlib CPU usage monitoring

Matplotlib Matplotlib, as a Python plotting library, is known for its capability to produce high-quality figures. Beyond static images, Matplotlib can also plot simple animations. While it doesn’t adopt OpenGL for high-performance graphics like VisPy, it is still sufficiently for basic academic and research applications. This post turn a default Matplotlib example into a straightforward CPU monitor and introduces the basics of Matplotlib animation functions.

Before diving in, we should explore Matplotlib animation function: matplotlib.animation.FuncAnimation. This function is very straightforward. Here’s an overview of its parameters:

1
class matplotlib.animation.FuncAnimation(fig, func, frames=None, init_func=None, fargs=None, save_count=None, **kwargs)

It is worth noting that **kwargs contains additional parameters, including the commonly used interval parameter, which sets the refresh rate in milliseconds. During refresh, FuncAnimation invokes the func function and plots based on frames, which can be an iterator, generator, or a sequence of frames.

We can start with implementing a basic animation, as shown below,

Matplotlib CPU monitoring

Implementation code,

1
2
3
4
5
6
7
8
9
10
11
12
13
14
15
16
17
18
19
20
21
22
23
24
25
26
27
28
29
30
31
32
33
34
35
36
37
38
39
40
41
42
43
44
45
46
47
48
49
50
51
52
53
54
55
56
57
58
59
60
61
62
63
64
65
66
67
# -*- coding: utf-8 -*-
"""
Created on Fri Nov 18 18:49:08 2016

@author: Orycho
"""
import numpy as np
from matplotlib.lines import Line2D
import matplotlib.pyplot as plt
import matplotlib.animation as animation
import matplotlib
matplotlib.style.use('ggplot')

# Axis setting
xRange = 20
ymin = -0.1
ymax = 1.1

class Scope(object):
    def __init__(self, ax, maxt=xRange):
        self.ax = ax
        self.maxt = maxt
        self.xdata = [0]
        self.ydata = [0]
        self.line = Line2D(self.xdata, self.ydata, ls='-',lw = 2, marker = '.',
                           alpha=0.8, color='gray', mfc='red', ms = 10)
        self.ax.add_line(self.line)
        self.ax.set_ylim(ymin, ymax)
        self.ax.set_xlim(0, self.maxt)

    def update(self, y):
#        self.ax.set_xlim((max(self.xdata)-20) / 1.05, max(self.xdata) * 1.1)
#        self.ax.figure.canvas.draw()
        lastt = self.xdata[-1]
        if lastt > self.xdata[0] + self.maxt:
            self.xdata = [self.xdata[-1]]
            self.ydata = [self.ydata[-1]]
            self.ax.set_xlim(self.xdata[0], self.xdata[0] + self.maxt)
            self.ax.figure.canvas.draw()

        t = self.xdata[-1] + y[0]
        self.xdata.append(t)
        self.ydata.append(y[1])
        self.line.set_data(self.xdata, self.ydata)
        return self.line


def emitter():
    while True:
        yield (np.random.rand(1),np.random.rand(1))

fig, ax = plt.subplots(figsize=(10, 8), dpi=80, facecolor='w', edgecolor='k')
plt.xlabel('Time',fontname="Times New Roman",fontsize = 15)
plt.ylabel('Usage',fontname="Times New Roman",fontsize = 15)
for tick in ax.get_xticklabels():
    tick.set_fontname("Times New Roman")
    tick.set_fontsize(15)
for tick in ax.get_yticklabels():
    tick.set_fontname("Times New Roman")
    tick.set_fontsize(15)
scope = Scope(ax)

# pass a generator in "emitter" to produce data for the update func
ani = animation.FuncAnimation(fig, scope.update, frames = emitter, interval=100,
                              blit=False)

plt.show()

The code utilizes a generator to produce frames, with a sampling interval of 100ms. This means the image is redrawn every 100ms. Since this example randomly generates drawings, we need to employ Python psutil module for actual CPU monitoring. Using the cpu_percent function from psutil, we can fetch the CPU usage rate as well as set an interval, which I currently set it as 1s to prevent slowing the system. By synchronizing the frame refresh rate with this interval, we can effectively achieve CPU monitoring capabilities,

1
2
3
4
5
6
7
8
9
10
11
12
13
14
15
16
17
18
19
20
21
22
23
24
25
26
27
28
29
30
31
32
33
34
35
36
37
38
39
40
41
42
43
44
45
46
47
48
49
50
51
52
53
54
55
56
57
58
59
60
61
62
63
64
65
66
67
68
# -*- coding: utf-8 -*-
"""
Created on Fri Nov 18 18:49:08 2016

@author: Orycho
"""
import numpy as np
from matplotlib.lines import Line2D
import matplotlib.pyplot as plt
import matplotlib.animation as animation
import matplotlib
import psutil
matplotlib.style.use('ggplot')
# Axis setting
xRange = 60
ymin = -5
ymax = 100

class Scope(object):
    def __init__(self, ax, maxt=xRange):
        self.ax = ax
        self.maxt = maxt
        self.xdata = [0]
        self.ydata = [0]
        self.line = Line2D(self.xdata, self.ydata, ls='-',lw = 2, marker = '.',
                           alpha=0.8, color='gray', mfc='red', ms = 10)
        self.ax.add_line(self.line)
        self.ax.set_ylim(ymin, ymax)
        self.ax.set_xlim(0, self.maxt)

    def update(self, y):
#        self.ax.set_xlim((max(self.xdata)-20) / 1.05, max(self.xdata) * 1.1)
#        self.ax.figure.canvas.draw()
        lastt = self.xdata[-1]
        if lastt > self.xdata[0] + self.maxt:
            self.xdata = [self.xdata[-1]]
            self.ydata = [self.ydata[-1]]
            self.ax.set_xlim(self.xdata[0], self.xdata[0] + self.maxt)
            self.ax.figure.canvas.draw()

        t = self.xdata[-1] + y[0]
        self.xdata.append(t)
        self.ydata.append(y[1])
        self.line.set_data(self.xdata, self.ydata)
        return self.line


def emitter():
    while True:
        cpu = psutil.cpu_percent(interval=1)
        yield (1,cpu)

fig, ax = plt.subplots(figsize=(10, 8), dpi=80, facecolor='w', edgecolor='k')
plt.xlabel('Time',fontname="Times New Roman",fontsize = 15)
plt.ylabel('Usage',fontname="Times New Roman",fontsize = 15)
for tick in ax.get_xticklabels():
    tick.set_fontname("Times New Roman")
    tick.set_fontsize(15)
for tick in ax.get_yticklabels():
    tick.set_fontname("Times New Roman")
    tick.set_fontsize(15)
scope = Scope(ax)

# pass a generator in "emitter" to produce data for the update func
ani = animation.FuncAnimation(fig, scope.update, frames = emitter, interval=1000,
                              blit=False)

plt.show()

Comparing it with the Task Manager,

Matplotlib CPU monitoring Matplotlib CPU monitoring

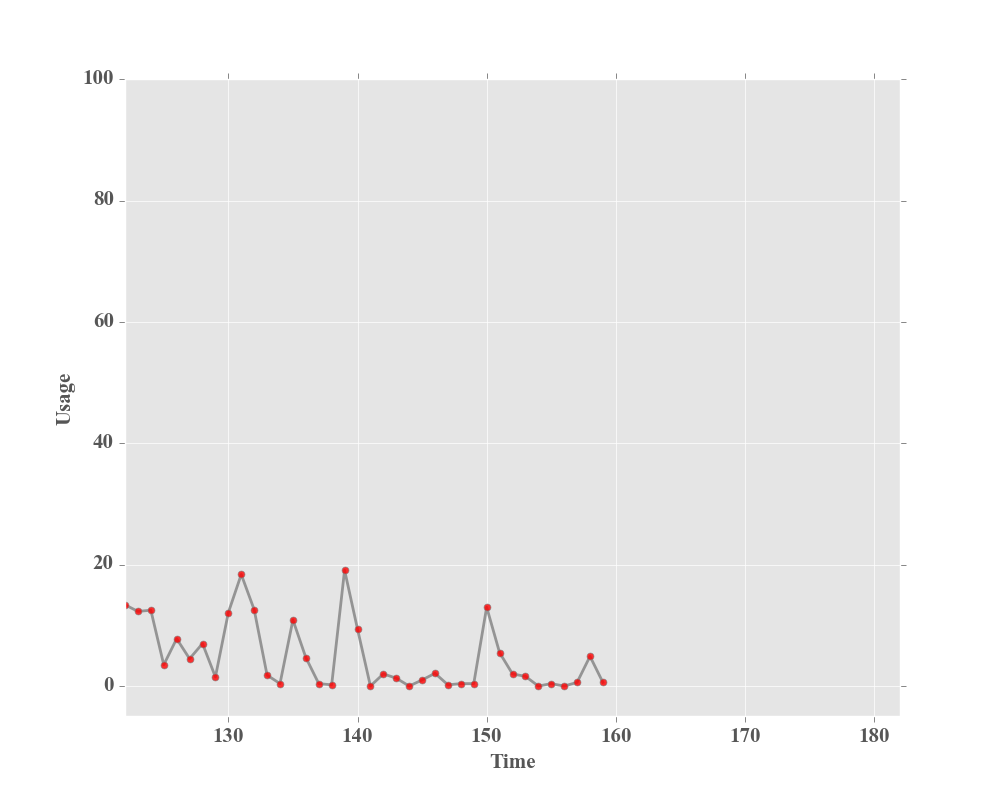
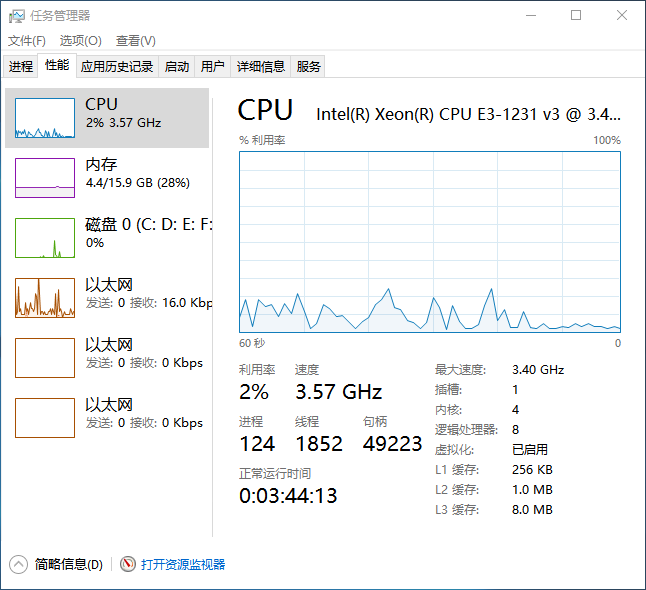
The Task Manager seems to sample every 0.5s, its display might appear more accurate. To shorten the monitoring interval, simply adjust the interval settings in the cpu_percent function and the frame refresh rate in the code above.

Besides using above method for animation, the graphic refreshes can also be achieved with blit. However, this method has a drawback: it prevents interaction with the graph during animation, and causes the process to freeze despite the impressive display effect. Here is an example,

Matplotlib CPU monitoring

All source code is available upon request.