 Let’s start with something important: for Python 3.5 with Anaconda, install OpenCV using the command:
1 | |
And to install Mayavi on Python 3.5 with Anaconda, use the command:
1 | |
These commands are tested and put here to avoid forgetting. Of course, if you’re not using Anaconda, you can ignore this.
Now, back to the main topic. When using Matplotlib for plotting, plotting simple figure usually does not have any problem. However, when an image contains many lines,despite Matplotlib ability to render the image smoothly, we might notice that panning and zooming can become very laggy. Let’s consider the following plotting code as an example,
1 | |
This would directly render the following figure,
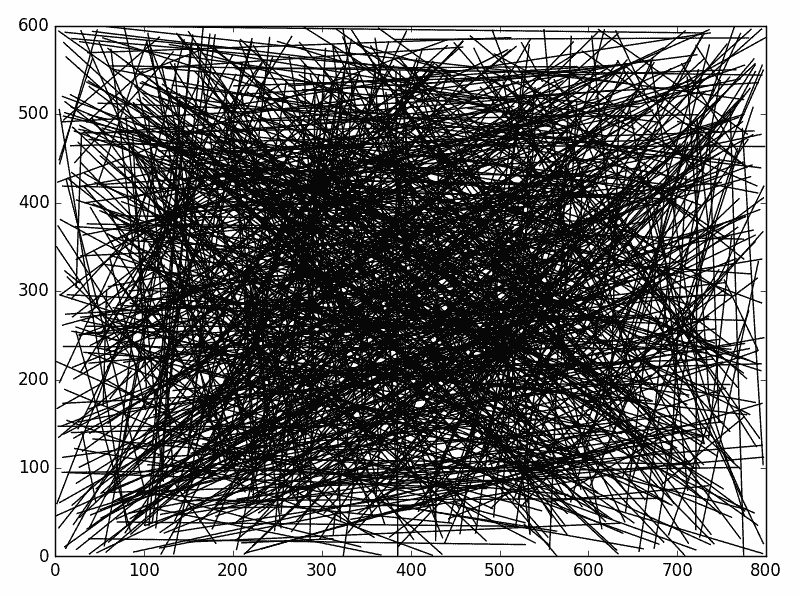
If you try to pan or zoom with this figure, it would display very sluggishly. Therefore, it is necessary to speed up Matplotlib figures. matplotlib.collections is a class designed specifically to speed up the rendering of a large number of shapes,
matplotlib.collections
Classes for the efficient drawing of large collections of objects that share most properties, e.g., a large number of line segments or polygons.
The classes are not meant to be as flexible as their single element counterparts (e.g., you may not be able to select all line styles) but they are meant to be fast for common use cases (e.g., a large set of solid line segemnts)
Thus, when plotting, first we can categorize all lines, and then use the add_collection() method to draw all line collections at once. This can significantly improve the refresh capability of Matplotlib figures. The experimental code is as follows,
1 | |
The figure produced using the above code demonstrates excellent responsiveness during panning and zooming. Due to the complexity of the image data, a GIF is not provided. Also, for 3D images, mplot3D provides corresponding collections, with Line3DCollection and Patch3DCollection, which are the most commonly used methods for speeding up rendering.