 During my previous usage of Mathematica commands to create a low-poly image with triangle patterns, I found an issue where the generated image consistently had white borders. But attempting to precisely control the image size with the crop command is useless, I have to process the image using highlight and binarization techniques. However, the issue of white borders remained unresolved. So, while I plot function graphs in Mathematica and set up grid lines, I found that the edges of the grid would often exceed the intended boundary. This resulted in the grid appearing as if it were laid over the function graph. So, I dedicated some time to search a solution and put my findings here.
Default Grid Lines
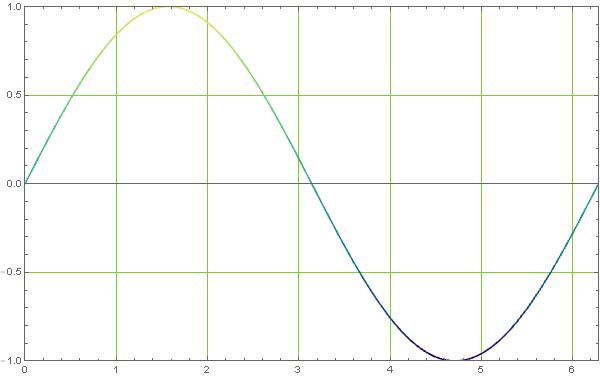
Upon opening a Mathematica notebook and plotting a colorful sine function curve with the command,
1 | |
The following image is obtained:
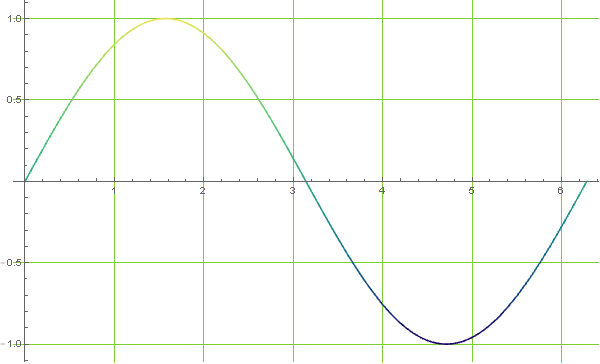
Examining the y-axis of the image shows that the grid extends beyond the intended boundary. This issue primarily arises from using the GridLines command where. Although the grid is confined within the PlotRange, Mathematica inadvertently adds extra padding around the image, causing the grid to fill beyond the coordinate lines.
Solution One
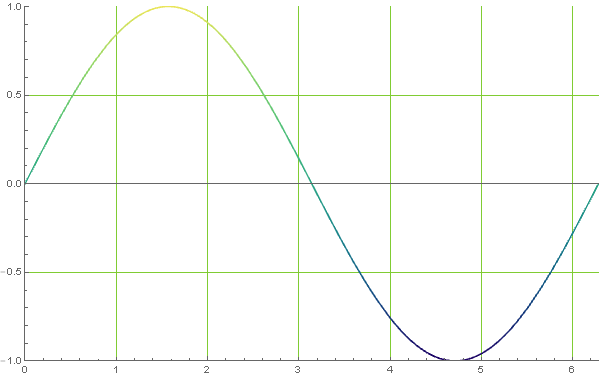
The simplest solution is to use the PlotRangePadding command to restrict Mathematica automatic extension of the padding area. According to the Mathematica help files, an additional 2% padding is added in each direction during plotting. The following command effectively limits this padding:
1 | |
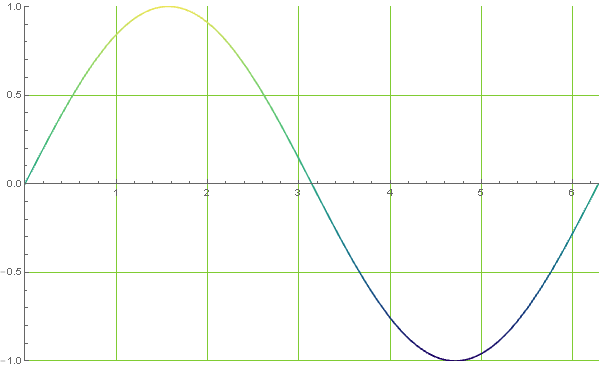
By constraining the padding, Mathematica now only shows the figure within the specified PlotRange,
This approach is also used for generating Graphics images. Without PlotRangePadding, images tend to have white borders:

However, these images are unsuitable for creating masks without adding PlotRangePadding->0. This produces the following result:

This adjustment significantly simplifies the process of mask application. Of course, if perfectionism isn’t a concern, adjusting the coordinate range slightly to accommodate the automatic 2% padding can also be a useful workaround:
Solution Two
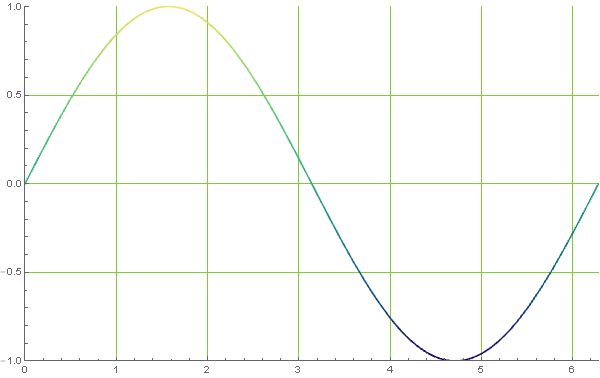
Alternatively, using a Frame to contain the image can effectively prevent any overflow beyond its boundaries. We can plot with the following command,
1 | |
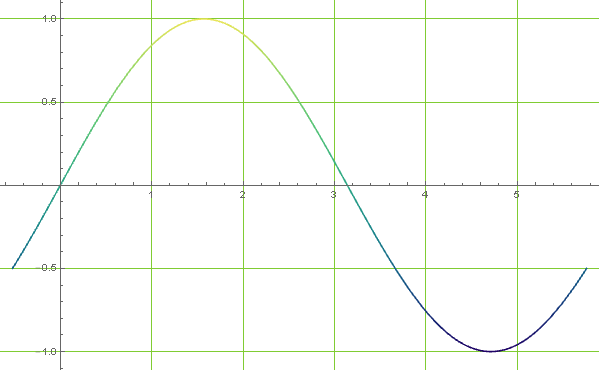
Generate the following figure,
A closer inspection shows that the automatic padding issue persists within the Frame interior. This allows the image to appear more complete. This can also be addressed by setting PlotRangePadding->0 for a fuller image display,
Moreover, adjusting the Frame visibility can mimic the appearance of a standard coordinate axis,
1 | |
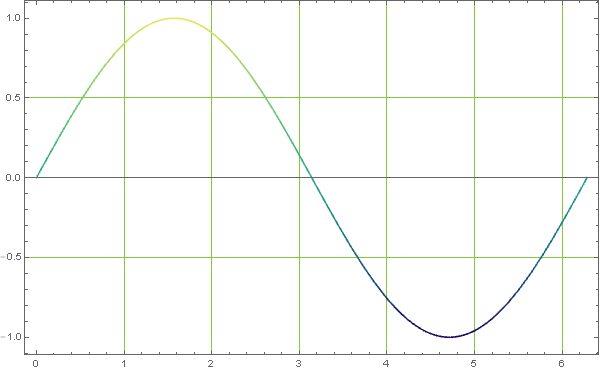
Resulting in the following graphic:
Adding AxesStyle -> Opacity[0] can completely hide the mid line in the figure,
This creates a visually appealing result:
Conclusion
It took me considerable effort to resolve this issue, primarily because the Graphics documentation did not explain how to eliminate white borders. Consequently, the idea of creating graphical masks remained unfulfilled until today’s discovery with Plot that grid lines exceeded their boundaries. This indicated that PlotRangePadding could provide a solution, and indeed, it proved effective.
The full script can be downloaded here: DOWNLOAD