 This post conducts a reliability analysis on a wrench in practical use via Ansys. Reliability analysis is a statistical method used to study the ability of a system or component to perform its required functions under stated conditions for a specified period of time. It’s fundamentally concerned with the assessment and prediction of product lifespan and identifying the likelihood of failures. The goal of reliability analysis is to identify areas of improvement in the design, manufacturing, and operational processes to enhance the overall dependability of products or systems.
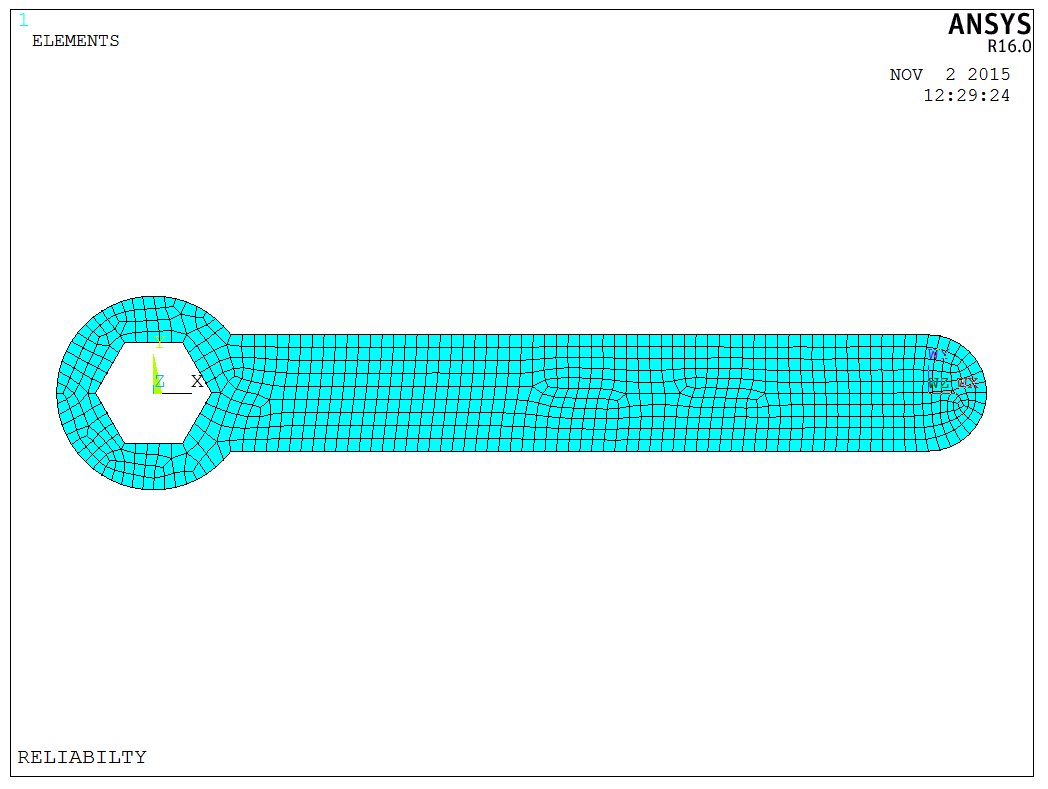
In real-world applications, the six corners of the wrench’s hexagon remain fixed, and a load is applied at the handle. The dimensions are shown as follows,

Based on strength theory analysis, it’s assumed that during the application of force, the stress must not exceed the yield strength; exceeding this threshold is considered a failure of the wrench. Thus, the failure criterion for the wrench is,
\[{\sigma _{\max }} \ge \sigma _{s }\]The limit state function is set as:
\[G(x) = {\sigma _s} – {\sigma _{\max }}\]If G(x) < 0 occur, it is considered that the wrench has failed, where x represents a vector of all uncertain factors. This post aims to solve for the probability of G(x) > 0.
Initially, a model is established. Before proceeding with probability analysis, it’s necessary to create a clean command for model using APDL or to document and tidy up a LOG file from GUI operations into a clean and executable command (i.e., clean APDL file). This step is crucial because probability analysis requires repeated modeling. The clean APDL file is necessary for analyzing problem when entering the PDS module.
For convenience, this post entirely utilizes command to create the model for minimizing unnecessary errors. At the modeling stage, basic dimensions are determined first, and then all variable dimensions that need to be changed (such as width, length, load, etc.) are assigned to corresponding variables. These variables are used in modeling to ensure the model is successfully established and completes one analysis.
The wrench model is constructed using the SHELL63 element, which is straightforward to generate,
To achieve our objective of obtaining the component’s maximum internal force for comparison with standard yield stress, the NSORT command is first used in APDL to sort all nodes by stress. Then, the *GET command retrieves the maximum stress value at the point.
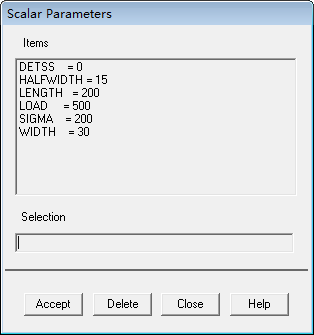
Define the variable name corresponding to the G(x) function and assign a value. Ansys Scalar Parameters can be used to check these variables. The defined variable name here is DETSS,
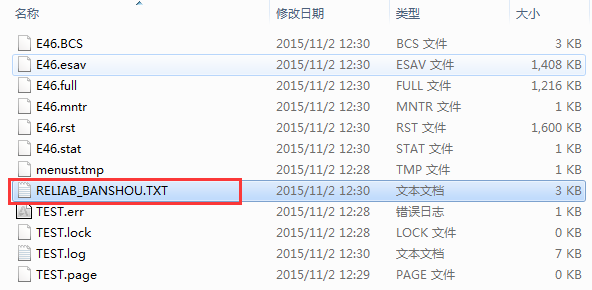
After successfully completing the analysis, the LGWRITE command records the entire analysis process into a file as a command stream.
Entering the PDS analysis module can be done by clicking Prob Design in the Ansys interface or entering /PDS in the command stream, followed by specifying the file needed for analysis, which is the file just written:
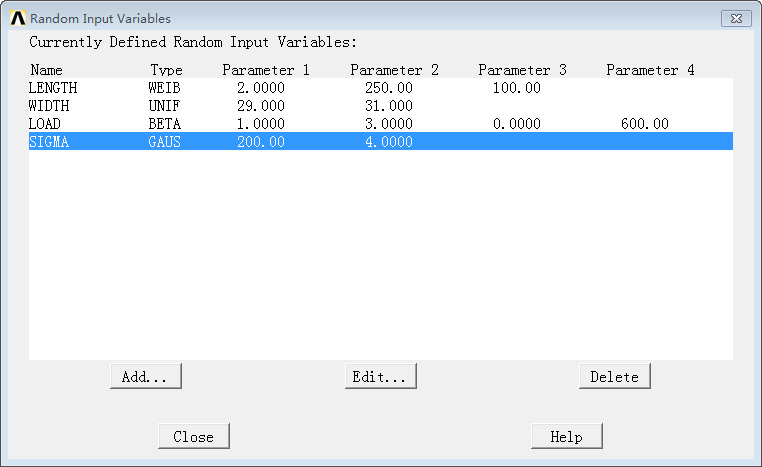
Following the order in the probability analysis, define the input variables, including length, width, and load, etc., with PDVAR. When defining, specify their probability distribution type, generally Gaussian distribution for errors, while other types can refer to relevant probability literature. (The defined variables should be the uncertain variables initially set in the analysis file, with consistent names.)
Then, define the output variables, which must have consistent names, defined using the following statement or via GUI operations.
1 | |
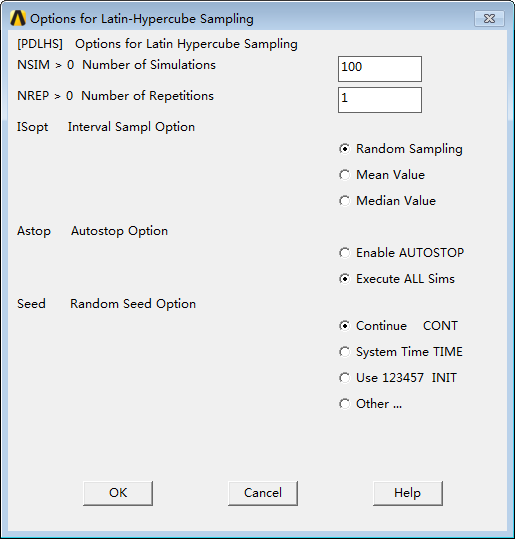
Regarding the analysis method, this post employs the Monte Carlo Latin Hypercube Sampling (LHS) method. Due to time constraints, the sampling number is set to 100 times, with other settings as shown below:
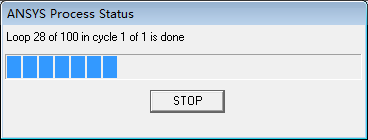
Run the analysis, with the duration depending on the machine’s capability and the number of cycles. Here, it’s set to 100 times, which is relatively fast, but patience is required for large number of cycles:
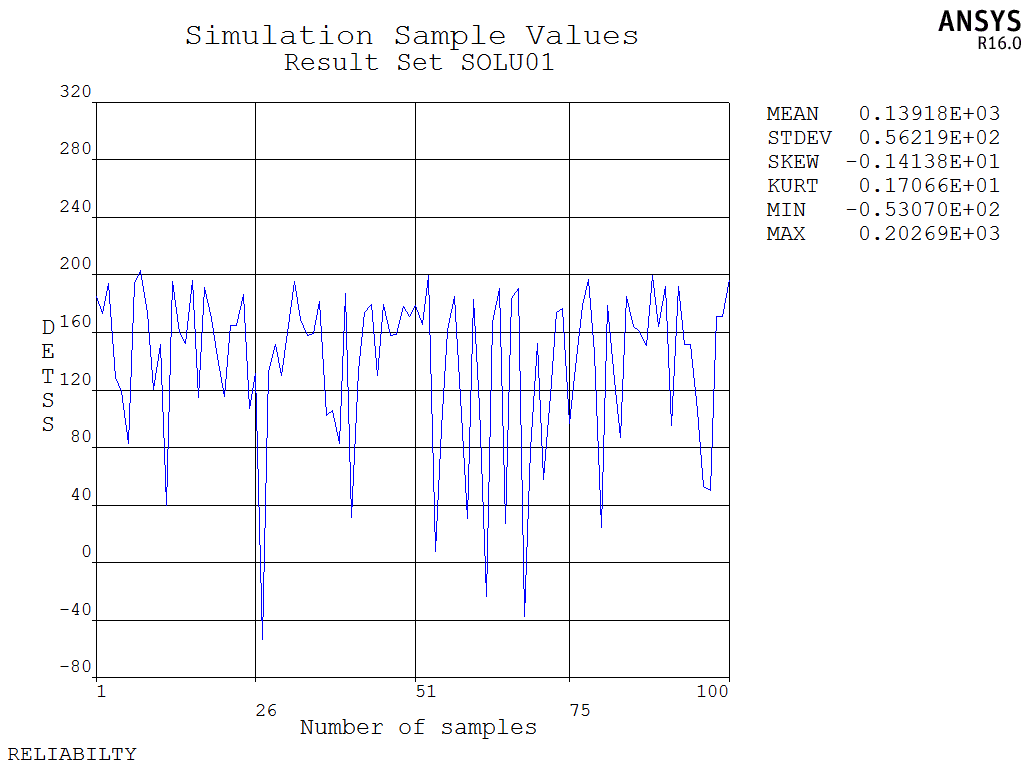
Upon completion, the results are as follows:
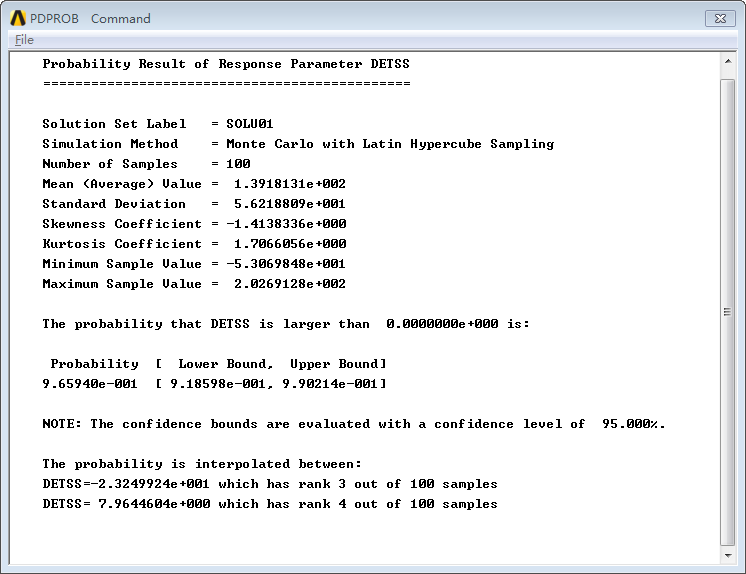
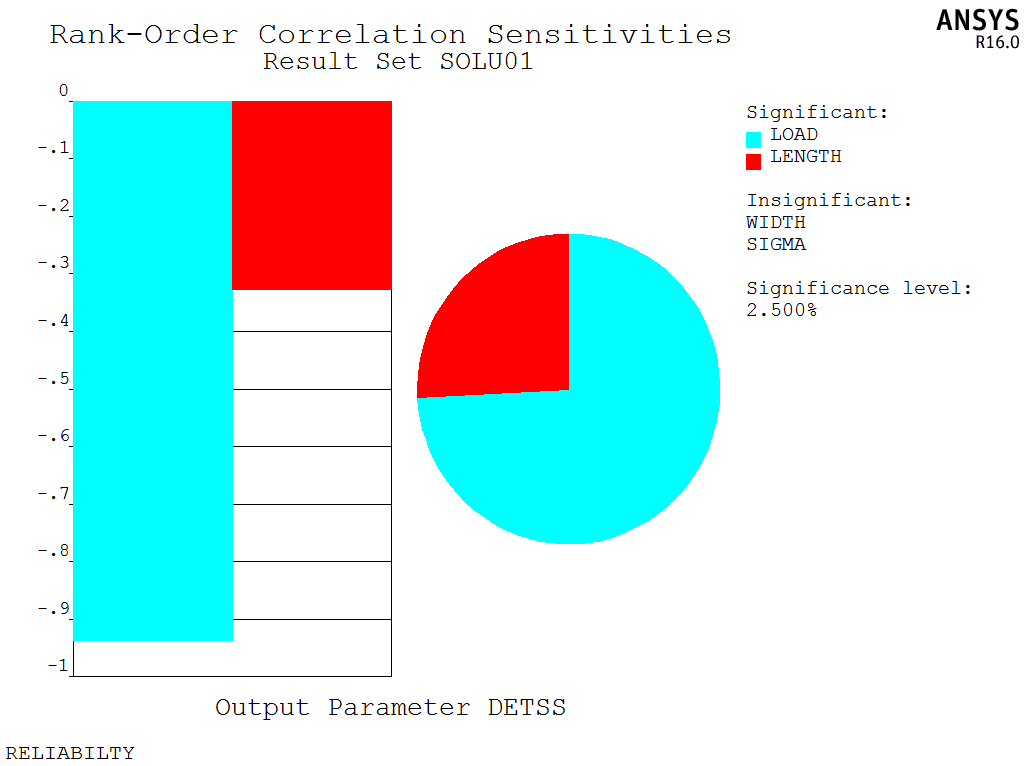
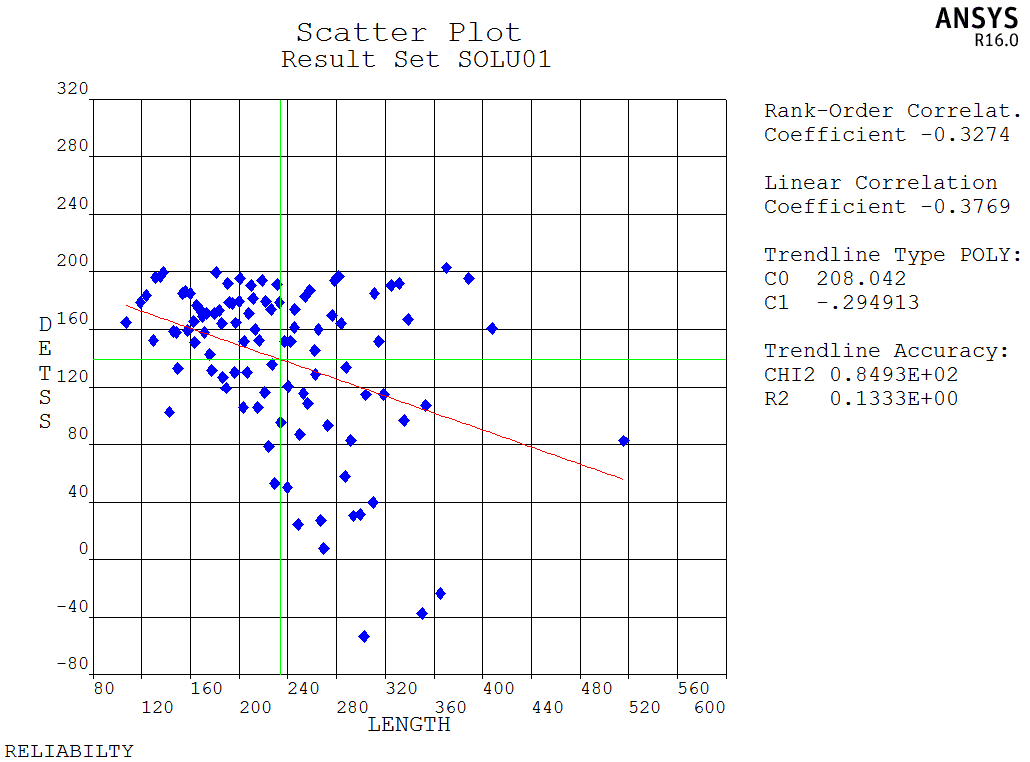
From the results, it can be observed that the probability of the wrench not failing is approximately 0.9659 at a 95% confidence level. The following figure shows the sensitivity coefficients between random input variables and random output variables, as well as the impact of the wrench’s length on the output variable:
The model is a test model, and the APDL code is available upon request.