OpenSees real-time node displacement

Realtime Last time, I discovered that the OpenSees recorder command can send data to a TCP port and monitored it with Python. This time, I decided to directly obtain the model displacement and display it in real-time. The recorder TCP transmission does not affect the computational efficiency of OpenSees and we can achieve the following the effect in the figure,
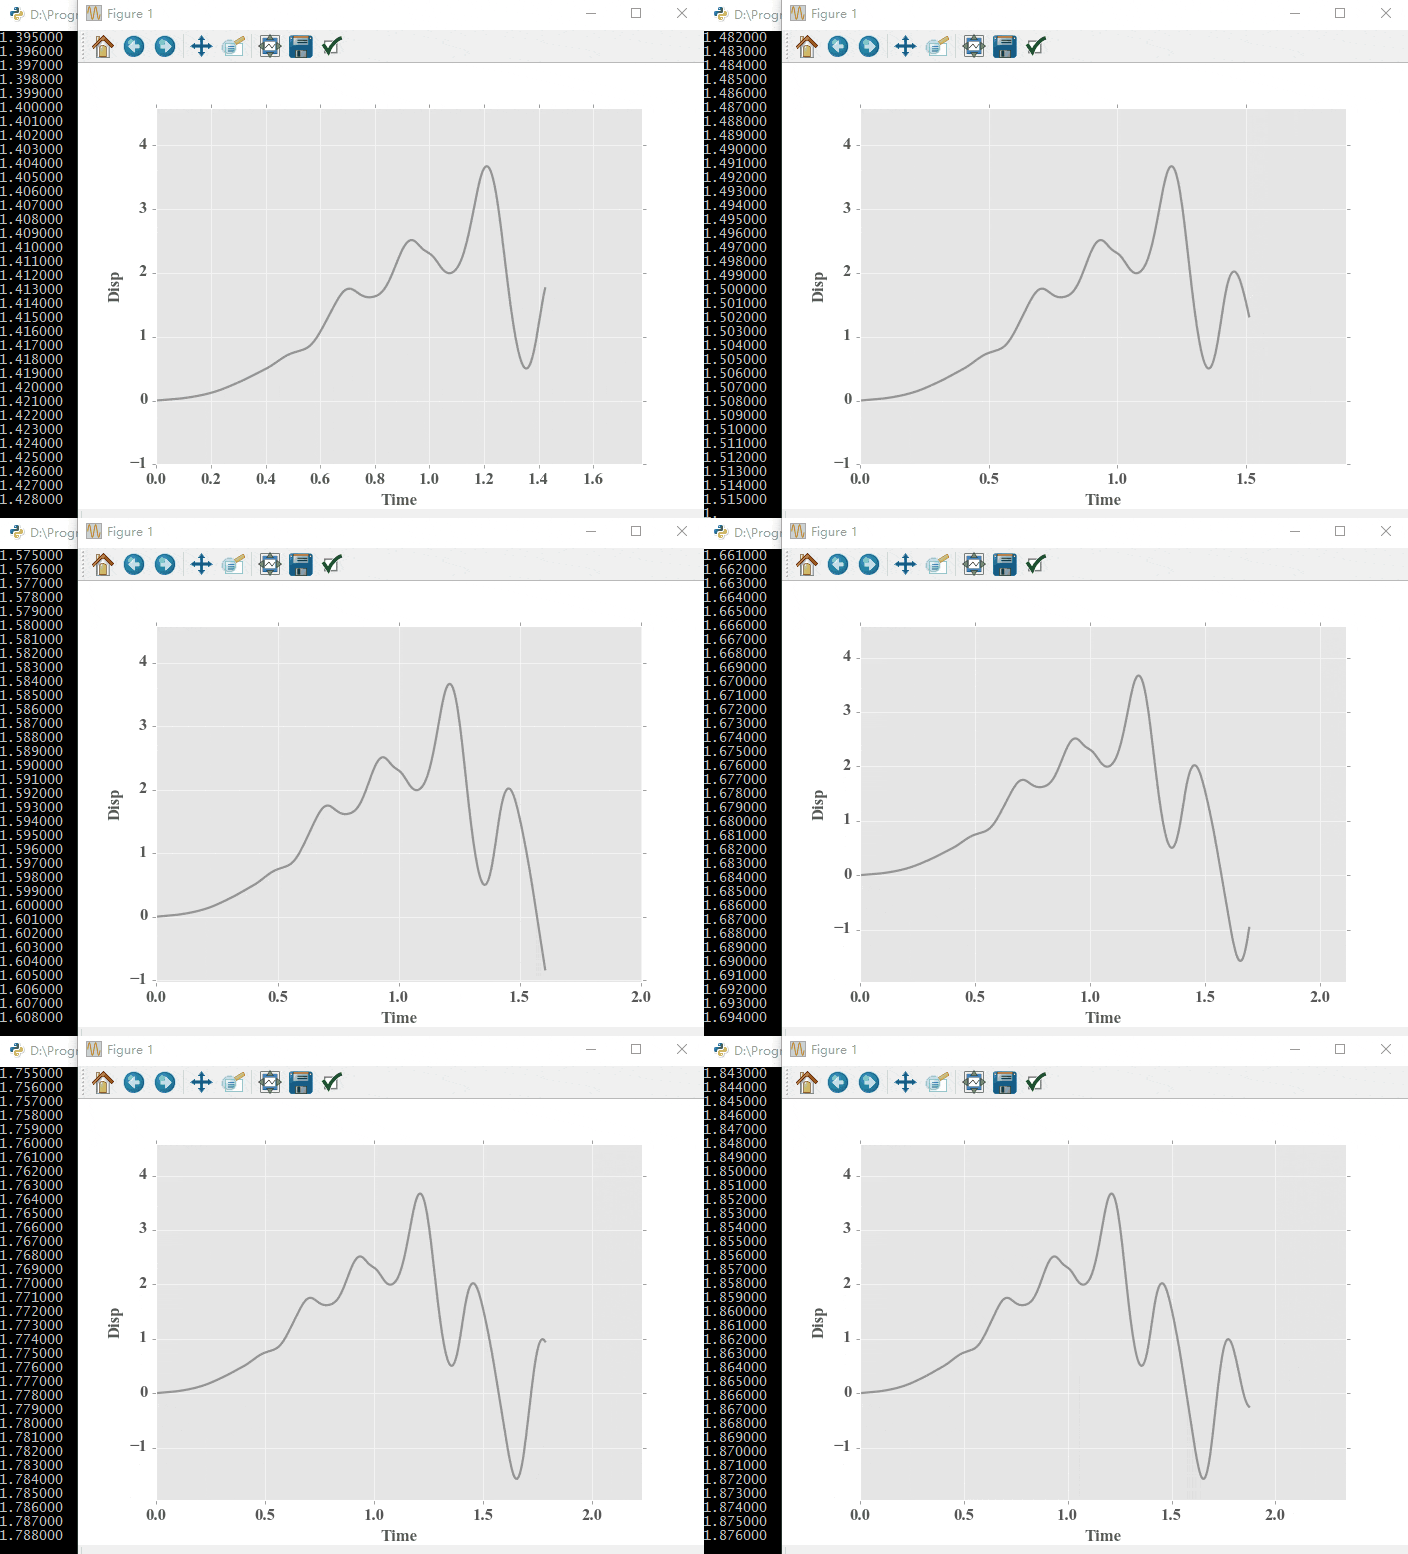
OpenSees realtime displacement

Since a loop is created to listen on a TCP port, it is necessary to use Python subprocess or threading module for monitoring displacement. The main difference between a subprocess and a threading is the variable sharing mechanism. A subprocess is an independent process, so it has its own variable space and requires consideration of communication between processes. In contrast, threads share the same variable space with the main thread, so it only needs to set a global variable to enable data transmission to the threads. Additionally, due to some design reasons in Python, using threading does not achieve concurrency. If we want to perform multi-core computing, it is better to use subprocess method.

Let’s plot the flowchart for real-time model display,

OpenSees realtime displacement

Before starting the plotting, it is necessary to add the following statement in the OpenSees model,

1
recorder Node -tcp 127.0.0.1 8099 -time -node 504 -dof 1 2 3 disp

The above statement sends the data of node 504 recorded by the recorder to port 127.0.0.1:8099. For more detailed information, see my previous post: OpenSees recorder data via TCP

First, define global variables and the port listening function,

1
2
3
4
5
6
7
8
9
10
11
12
13
14
15
16
17
18
19
20
21
22
23
24
25
26
27
28
29
30
31
32
33
34
35
36
37
38
39
40
41
42
43
44
45
46
47
48
49
50
51
52
53
54
55
56
57
# -*- coding: utf-8 -*-
"""
Created on Thu Nov 24 18:49:08 2016

@author: orycho
"""
###################################
import socket
from struct import Struct
###################################
HOST = '127.0.0.1'
PORT = 8099
###################################
TotalData = []
Data=[]
###################################
def OTCP():
    global Data,TotalData,HOST,PORT
    
    tcpSerSock = socket.socket(socket.AF_INET, socket.SOCK_STREAM)
    tcpSerSock.bind((HOST, PORT))
    
    tcpSerSock.listen(5)
    unpacker = Struct('d')
    while True:
        print('waiting for connection...')
        (tcpCliSock, address) = tcpSerSock.accept()
        print('Connected from:',address)
        
    
        datarecv = tcpCliSock.recv(unpacker.size)
        DataSize = unpacker.unpack(datarecv)[0]
        
        print('Data Size == {0}'.format(DataSize))
        
        SizeReceived = 0
        while True:
            try:
                datarecv = tcpCliSock.recv(unpacker.size)
            
                if SizeReceived > 0:	
                    Data.append(unpacker.unpack(datarecv)[0])
            
    
                if SizeReceived == DataSize:
                    SizeReceived = 0
                    TotalData=Data
                    Data = []
                else:
                    SizeReceived += 1
            except:
                print('disconnect from:', address)
                tcpCliSock.close()  # 退出
                break
        
    tcpSerSock.close()
###################################

Note that two global variables are defined above. The global variable Data is refreshed and cleared after each data reception, so it is not suitable for plotting. Actual data used for plotting will be read from TotalData.

Then, we need to define the subprocess part for OpenSees, which is used to call OpenSees to run FILENAME after starting TCP listening,

1
2
3
4
5
6
7
8
9
10
11
12
13
14
15
16
# -*- coding: utf-8 -*-
"""
Created on Thu Nov 24 18:49:08 2016

@author: orycho
"""
import subprocess
FILENAME = 'main.tcl'
def COPS():
    try:
        outPuts = subprocess.check_output(['opensees',FILENAME])
    except subprocess.CalledProcessError as e:
        outPuts = e.output
        code = e.returncode
        print(outPuts)
        print(code)

Here, the simple check_output is used to run the opensees with FILENAME. It is worth noting that I have already added the folder where the OpenSees program is located to the PATH in the system environment variables, so opensees command can be used directly to start OpenSees analysis. Later, Matplotlib is called for plotting. The basic form is similar to the previous CPU monitoring. I slightly adjusted the figure refresh method. The figure axes will change as the data set changes,

1
2
3
4
5
6
7
8
9
10
11
12
13
14
15
16
17
18
19
20
21
22
23
24
25
26
27
28
29
30
31
32
33
34
35
36
37
38
39
40
41
42
43
44
45
46
47
from matplotlib.lines import Line2D
import matplotlib.pyplot as plt
import matplotlib.animation as animation
import matplotlib
matplotlib.style.use('ggplot')
# Axis setting
xRange = 1
ymin = -1
ymax = 1

class Scope(object):
    def __init__(self, ax, maxt=xRange):
        self.ax = ax
        self.maxt = maxt
        self.xdata = [0]
        self.ydata = [0]
        self.line = Line2D(self.xdata, self.ydata, ls='-',lw = 2, 
                           alpha=0.8, color='gray')
        self.ax.add_line(self.line)
        self.ax.set_ylim(ymin, ymax)
        self.ax.set_xlim(0, self.maxt)

    def update(self, y):
        lastx = self.xdata[0] + y[0]
        if lastx > self.xdata[0] + 3/4*self.maxt:
            self.ax.set_xlim(self.xdata[0], max(self.maxt,5/4*lastx))
            self.ax.figure.canvas.draw()
        lasty = y[1]
        if lasty > max(self.ydata):
            temp = self.ax.get_ylim()[0]
            self.ax.set_ylim(temp, max(ymax,5/4*y[1]))
            self.ax.figure.canvas.draw()
        elif lasty < min(self.ydata):
            temp = self.ax.get_ylim()[1]
            self.ax.set_ylim(min(ymin,5/4*y[1]), temp)
            self.ax.figure.canvas.draw()

        x = self.xdata[0] + y[0]
        self.xdata.append(x)
        self.ydata.append(y[1])
        self.line.set_data(self.xdata, self.ydata)
        return self.line


def emitter():
    while True:
        yield (TotalData[0],TotalData[1])

Let’s talk about the emitter generator first, which is used as frames for the figure. Matplotlib frames can use iterators and generators as parameters, and Matplotlib will sequentially obtain frames from them for figure update functions. Additionally, the generator returns a tuple representing the newly generated data, which comes from the TotalData. The update function, which updates the figure, is called at each interval. This function takes one parameter, which is the current frame, coming from the frames iterator or generator return value.

In the update function, it checks whether the data set edges have reached the edges of the axes. If so, it updates the axes and refreshes the figrue. Next, start the threads and begin plotting,

1
2
3
4
5
6
7
8
9
10
11
12
13
14
15
16
17
18
19
20
21
22
23
24
import time
import sys
import threading
OTread = threading.Thread(target=OTCP, name='OTCP')
OTread.start()
OCOPS = threading.Thread(target=COPS, name='COPS')
OCOPS.start()
time.sleep(3)
fig, ax = plt.subplots(figsize=(10, 8), dpi=80, facecolor='w', edgecolor='k')
plt.xlabel('Time',fontname="Times New Roman",fontsize = 15)
plt.ylabel('Disp',fontname="Times New Roman",fontsize = 15)
for tick in ax.get_xticklabels():       # 设置标签字体
    tick.set_fontname("Times New Roman")
    tick.set_fontsize(15)
for tick in ax.get_yticklabels():
    tick.set_fontname("Times New Roman")
    tick.set_fontsize(15)
scope = Scope(ax)

ani = animation.FuncAnimation(fig, scope.update, frames = emitter, interval=100,
                              blit=False)

plt.show()
sys.exit()

This allows to plot the animation above. However, it is important to note that when I started the OpenSees, I used time.sleep(3) to pause the program for three seconds. This is because OpenSees itself also needs to parse and execute TCL language. Therefore, without pausing, the plotting function cannot obtain data from TotalData at the beginning, and the main program would exit with an error. Besides, we should try to run the program on the local machine during its operation. Online testing might experience packet loss, a issue that has been discussed previously and will not be discussed again.

All source code is available upon request.