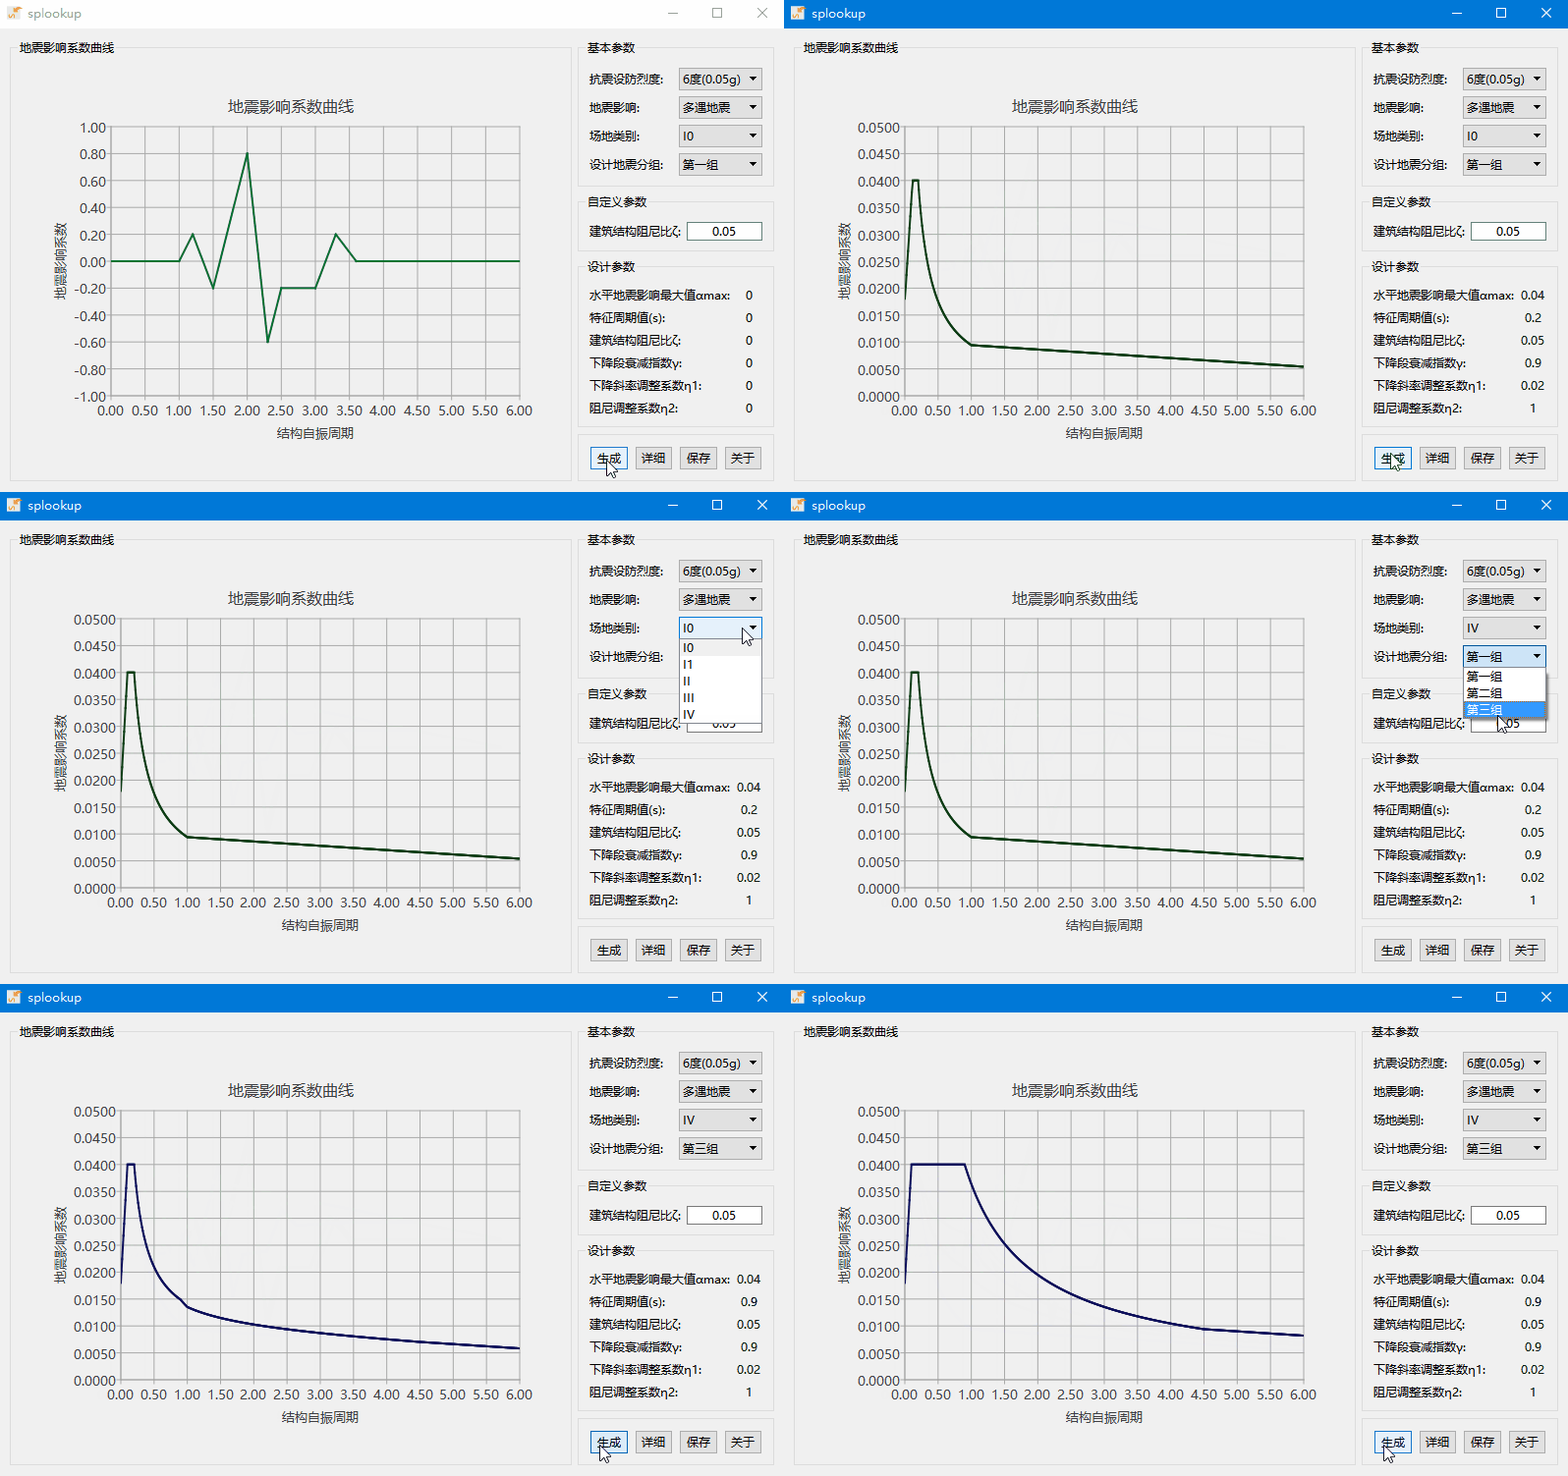
 I have some free time on a weekend afternoon, so I decided to create a small utility. It’s been a while since I last used Qt for software development, so the development process was a bit of a struggle, but after several hours of effort, I finally completed it. The utility uses Qt Charts in Qt 5.7 as the drawing tool. It appears that Qt Charts now supports GPU acceleration, which feels great to use and delivers impressive results.

The software calculates the seismic coefficient curves based on the specification of GB 50011-2010, section 5.1.4. The “Seismic Influence” for “Seismic Fortification” is based on section 3.10.3 of GB 50011-2010.
Download and Installation
The software is compatible with Windows (x32, x64) platforms: DOWNLOAD
Basic Operations
The graphical area supports keyboard and mouse operations:
- ”+”: Zoom in
- ”-“: Zoom out
- “↑”: Move up
- “↓”: Move down
- “←”: Move left
- “→”: Move right
- Drag with the left mouse button to zoom in
- Right-click to zoom out